groupby
집단변수 (=범주형 번수, 카테고리)를 이용한 자료 처리
1. 집단변수 기준 subset 만들기
2. 집단변수 기준 그룹, 통계량 구하기
3. 그룹과 통계량 시각화
import pandas as pd #csv file
import matplotlib.pyplot as plt #그룹과 통계량 시각화
dataset load & 변수 확인
wine = pd.read_csv(r'C:\ITWILL\4_Python-2\data\winequality_both.csv')
wine.info()
공백 -> '_' 교체
wine.columns = wine.columns.str.replace(' ','_')
wine.columns

wine.fixed_acidity
5개 변수 선택 : subset 만들기
wine_df = wine.iloc[:,[0,1,4,11,12]] #iloc : 위치기반 행렬 선택 / 행 전체 선택 / 열 색인
wine_df.info()
0 type 6497 non-null object
1 fixed_acidity 6497 non-null float64
2 residual_sugar 6497 non-null float64
3 alcohol 6497 non-null float64
4 quality 6497 non-null int64
칼럼명 변경 (전체변경)
wine_df.columns = ['type', 'acidity', 'sugar', 'alcohol', 'quality']
칼럼명 변경 (일부분 변경) : {'old':'new'}
columns = {'fixed_acidity' : 'acidity', 'residual_sugar' : 'sugar'}
wine_df = wine_df.rename(columns = columns)
wine_df.info()
0 type 6497 non-null object
1 acidity 6497 non-null float64 -> 변경
2 sugar 6497 non-null float64 -> 변경
3 alcohol 6497 non-null float64
4 quality 6497 non-null int64
집단변수 확인 : 와인 유형
wine_df.type.unique() #array(['red', 'white'], dtype=object)
wine_df.type.nunique() #2
wine_df['type'].value_counts()
white 4898
red 1599
이산변수 확인 : 와인 품질
wine_df.quality.unique() #[5, 6, 7, 4, 8, 3, 9]
wine_df.quality.value_counts()
6 2836 -> 6의 퀄리티를 가진 와인의 빈도수가 제일 많다
5 2138
7 1079
4 216
8 193
3 30
9 5
1. 집단변수 기준 subset 만들기
1) 1개 집단 기준
red_wine = wine_df[wine['type']=='red'] #red와인 선택
red_wine.shape() #(1599, 5)

red_wine.head()
2) 2개 이상 집단 기준
two_wine = wine_df[wine['type'].isin(['red', 'white'])] #type 칼럼의 red or white 조건 지정해 subset 만들기
two_wine.shape #(6497, 5)
two_wine.head() #red와인 확인
two_wine.tail() #white와인 확인

two_wine['type'].value_counts() #white 4898 / red 1599
3) 집단변수 기준 특정 변수 선택 : 1차원
집단1 : 레드와인 품질
red_wine_quality = wine_df.loc[wine['type']=='red', 'quality'] #명칭 기반 행렬 선택
red_wine_quality.shape #(1599,) : 2차원 -> 1차원. quality가 가진 vector길이만 반환
집단2 : 화이트와인 품질
white_wine_quality = wine_df.loc[wine['type']=='white', 'quality']
white_wine_quality.shape #(4898,)
2. 집단변수 기준 그룹 & 통계량
1) 집단변수 1개 이용 그룹화
형식) DF.groupby('집단변수')
type_group = wine_df.groupby('type')
print(type_group) #DataFrameGroupBy object

dir(type_group) #호출 가능한 메서드 확인
type_group.size() #집단 별 빈도수
red 1599
white 4898
2) 집단별 통계량 : group + apply
type_group.mean() acidity sugar alcohol quality -> 평균에 대한 통계량 제공
type -> type에 의해 두 집단으로 나뉨
red 8.319637 2.538806 10.422983 5.636023
white 6.854788 6.391415 10.514267 5.877909
type_group.std() #표준편차 acidity sugar alcohol quality
type
red 1.741096 1.409928 1.065668 0.807569
white 0.843868 5.072058 1.230621 0.885639
특정 변수 대상 통계량
type_group['quality'].mean()
type_group['quality'].describe() #요약통계량
2) 집단변수 2개 이용
형식) DF.groupby(['집단변수1', '집단변수2']) : 1차 -> 2차
wine_group = wine_df.groupby(['type','quality'])
wine_group.size()

group_size = wine_group.size()
group_size.shape #(13,) : 1차원
1차원 -> 2차원
group_size_2d = group_size.unstack()
group_size_2d
quality 3 4 5 6 7 8 9
type
red 10.0 53.0 681.0 638.0 199.0 18.0 NaN -> 결측치 발생
white 20.0 163.0 1457.0 2198.0 880.0 175.0 5.0
3. 그룹 & 통계량 시각화
1) 와인 유형별 품질 : 빈도수 기준
type(group_size_2d) #pandas.core.frame.DataFrame

group_size_2d.plot(kind='barh', stacked=True,
                   title='red vs white wind quality')
plt.show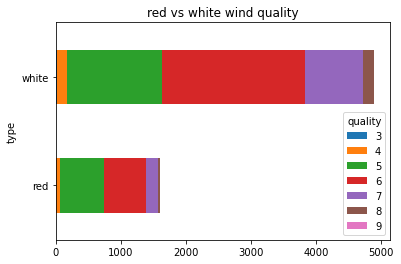
2) 그룹 통계 시각화
type_mean = type_group.mean()
type_mean[['sugar', 'alcohol']].plot(kind='bar')
plt.show()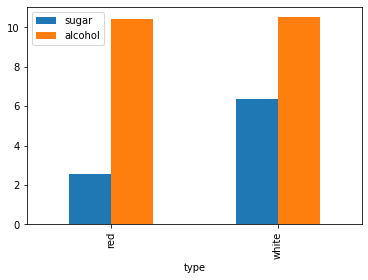
apply
그룹 객체에 외부함수 적용(apply)
1. group.apply (외부함수)
group.member() vs gropy.apply(외부함수)
2. group.agg ([외부함수1, 외부함수2, ...])
dataset load
import seaborn as sns

iris = sns.load_dataset('iris')
iris.info()
특정 칼럼 1개 대상 그룹 객체
iris_grp = iris['sepal_length'].groupby(iris['species'])

iris_grp.size()
setosa 50
versicolor 50
virginica 50
dir(iris_grp)
iris_grp.mean() #group.member()
setosa 5.006
versicolor 5.936
virginica 6.588
사용자 정의 함수
def avg(group) :
    return group.mean()

def avg(diff) :
    return group.max() - group.min()
1. group.apply(외부함수)
iris_grp.apply(sum) #내장함수
iris_grp.apply(avg) #사용자함수
iris_grp.apply(max) #내장함수
iris_grp.apply(min) #내장함수
2. group.agg(['내장함수', 사용자 정의함수, '내부함수'])
iris_grp.agg(['sum', avg, 'max', 'min', diff]) sum avg max min
species
setosa 250.3 5.006 5.8 4.3
versicolor 296.8 5.936 7.0 4.9
virginica 329.4 6.588 7.9 4.9
pivot_table
피벗테이블(pivot table)
DF 객체를 대상으로 행과 열 그리고 교차 셀에 표시될 칼럼을 지정하여 만들어진 테이블
형식) pivot_table(DF, values='교차셀 칼럼',
index = '행 칼럼', columns = '열 칼럼'
,aggFunc = '교차셀에 적용될 함수')
import pandas as pd
csv file load
pivot_data = pd.read_csv(r'C:\ITWILL\4_Python-2\data\pivot_data.csv')
pivot_data.info()
0 year 8 non-null int64 : 년도
1 quarter 8 non-null object : 분기
2 size 8 non-null object : 매출규모
3 price 8 non-null int64 : 매출액
피벗테이블(pivot table)
ptable = pd.pivot_table(pivot_data, values='price',
                index = ['year','quarter'], columns = 'size'
                ,aggfunc= 'sum')

print(ptable)
size LARGE SMALL
year quarter
2016 1Q 2000 1000
2Q 2500 1200
2017 3Q 2200 1300
4Q 2800 2300
type(ptable) #pandas.core.frame.DataFram

ptable.plot(kind='barh', stacked=True)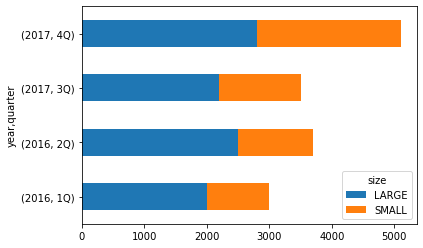
'데이터분석가 과정 > Python' 카테고리의 다른 글
| DAY48. Python Numpy (2)reshape, 난수, 행렬곱 (0) | 2021.11.29 |
|---|---|
| DAY47. Python Numpy (1)배열, 색인, 범용함수 (0) | 2021.11.26 |
| DAY45. Python Matplot (3)Seaborn (0) | 2021.11.23 |
| DAY44. Python Matplot (2)PandasPlot (0) | 2021.11.22 |
| DAY43. Python Matplot (1)Matplotlib (0) | 2021.11.19 |