DAY55. Python Cluster&Recommand (계층군집분석, KMeans, 추천시스템모형)
군집 분석
유사도가 높은 데이터 군집화
유사도(유클리드안 거리식)가 높은 데이터끼리 그룹화
계층형 클러스터링과 비계층형 클러스터링으로 분류
- K-means : 비계층적 군집분석
- Hierarchical : 계층적 군집분석
군집분석 특징
종속변수(y변수)가 없는 데이터 마이닝 기법
전체적인 데이터 구조를 파악하는데 이용
관측대상 간 유사성을 기초로 비슷한 것 끼리 그룹화(Clustering)
유클리드 거리 기반 유사 객체 묶음 (유사성 = 유클리드 거리)
* 관측대상 p와 q의 대응하는 변량값의 차가 작으면, 두 관측대상은 유사하다고 정의하는 식
ex. 고객 DB -> 알고리즘 적용 -> 패턴 추출(rule) -> 근거리 모 형으로 군집형성
계층적 군집분석(탐색적), 비계층적 군집분석(확인적)
주요 알고리즘 : k-means, hierarchical
분석결과에 대한 가설 검정 없음(타당성 검증 방법 없음)
분야 : 사회과학, 자연과학, 공학 분야
척도 : 등간, 비율척도(연속적인 양)
| 계층적 군집 분석 | 비 계층적 군집 분석 |
| 유클리드 거리를 이용한 군집분석 방법 계층적(hierarchical)으로 군집 결과 도출 탐색적 군집분석 |
확인적 군집분석 방법 계층적 군집분석법 보다 속도 빠름 군집의 수를 알고 있는 경우 이용 K는 미리 정하는 군집 수 계층적 군집화의 결과에 의거하여 군집 수 결정 변수보다 관측대상 군집화에 많이 이용 군집의 중심(Cluster Center) 사용자가 정함 |
| 군집화 방식 1. 단일기준결합방식 2. 완전기준결합방식 3. 평균기준결합방식 |
k-평균 군집분석 알고리즘 |
| 결과 : 벤드로그램 |
계층적 군집분석(Hierarchical Clustering)
상향식(Bottom-up)으로 계층적 군집 형성
유클리드안 거리계산식 이용
숫자형 변수만 사용
from sklearn.datasets import load_iris #dataset
import pandas as pd #DataFrame
from scipy.cluster.hierarchy import linkage, dendrogram #군집분석 tool
import matplotlib.pyplot as plt #산점도 시각화
1. dataset loading
iris = load_iris() #Load the data

X = iris.data #x변수
y = iris.target #y변수(target) - 숫자형 : 거리계산
numpy -> DataFrame
iris_df = pd.DataFrame(X, columns=iris.feature_names)
iris_df['species'] = y #target 추가

iris_df.info()
# Column Non-Null Count Dtype
--- ------ -------------- -----
0 sepal length (cm) 150 non-null float64
1 sepal width (cm) 150 non-null float64
2 petal length (cm) 150 non-null float64
3 petal width (cm) 150 non-null float64
4 species 150 non-null int32 -> object에서 int형으로
2. 계층적 군집분석
clusters = linkage(iris_df, method='complete')method = 'complete' : default - 완전연결
method = 'simple' : 단순연결
method = 'average' : 평균연결
print(clusters)
clusters.shape #(149, 4)
3. 텐드로그램 시각화 : 군집수는 사용자가 결정
plt.figure(figsize = (25, 10))
dendrogram(clusters)
plt.show()
[해석] y축에 유클리드 거리계산식. 최상단 군집이 가장 먼 것. 군집의 개수는 분석자의 몫.
4. 군집 수 자르기 -> 3개
cluster = fcluster(clusters, t=3, criterion='maxclust') #criterion : 가까운 거리 기준으로 자르기
cluster #1~3
len(cluster) #150
2) 칼럼 추가
iris_df['cluster'] = cluster
print(iris_df)

iris_df.columns
3) 산점도 시각화(x=1 칼럼, y=3 칼럼, c=cluster)
plt.scatter(x = iris_df['sepal length (cm)'],
            y = iris_df['petal length (cm)'],
            c = iris_df['cluster'])
plt.show
[해석] 좌측에서부터 1, 3, 2번 군집 순서
5. 군집별 특성 분석
1) 그룹(clust) 객체
cluster_g = iris_df.groupby('cluster')
cluster_g.size()
cluster
1 50
2 34
3 66
dtype: int64
2) 군집의 평균
cluster_g.mean() #species(범주형 변수) : 1번군집(0), 2번군집(2), 3번군집(1+2) sepal length (cm) sepal width (cm) ... petal width (cm) species
cluster ...
1 5.006000 3.428000 ... 0.246000 0.000000
2 6.888235 3.100000 ... 2.123529 2.000000
3 5.939394 2.754545 ... 1.445455 1.242424
kMeans
kMeans알고리즘
확인적 군집분석
군집 수 k를 알고 있는 경우 이용
import pandas as pd #DataFrame
from sklearn.cluster import KMeans #kMeans model
import numpy as np #array
import matplotlib.pyplot as plt #시각화
1. text file -> dataset 생성
file = open(r'C:\ITWILL\4_Python-2\data\testSet.txt')
lines = file.readlines() #list반환
print(lines, len(lines)) #80개

dataset = []
for line in lines : #'1.658985\t4.285136\n'
    cols = line.split('\t') #'1.658985', '4.285136\n'
    rows = [] #1행 저장
    for col in cols : #'1.658985', '4.285136\n'
        rows.append(float(col)) #float형 형변환 [1.658985, 4.285136]

    dataset.append(rows) #[[1.658985, 4.285136],... [-4.905566, -2.911070]]
list -> numpy
dataset_arr = np.array(dataset)
dataset_arr.shape #(80, 2)

plt.scatter(x = dataset_arr[:,0], y = dataset_arr[:,1])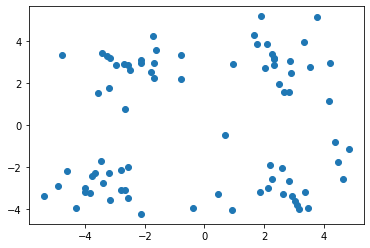
2. DF생성
data_df = pd.DataFrame(dataset_arr, columns = ['x', 'y'])
data_df
3. KMeans model
model = KMeans(n_clusters = 4, algorithm = 'auto')
model.fit(data_df) #dataset적용
kMeans model 예측치
pred = model.predict(data_df)
print(pred) #산점도에서 4개(0~3)의 군집으로 쪼갰을 때 예측해서 반환

dir(model)
[3 0 1 2 3 0 1 2 3 0 1 2 3 0 1 2 3 0 1 2 3 0 1 2 3 0 1 2 3 0 1 2 3 0 1 2 3
0 1 2 3 0 1 2 3 0 1 2 3 0 1 2 3 0 1 2 3 0 1 2 3 0 1 2 3 0 1 2 3 0 1 2 3 0
1 2 3 0 1 2]
각 군집 중앙값
centers = model.cluster_centers_array([[-2.46154315, 2.78737555],
[ 2.80293085, -2.7315146 ],
[-3.38237045, -2.9473363 ],
[ 2.6265299 , 3.10868015]])
4. kMeans model 시각화
data_df['predict'] = pred
data_df.info()
산점도
plt.scatter(x = data_df['x'], y = data_df['y'],
            c = data_df['predict'])
중앙값 추가
plt.scatter(x = centers[:, 0], y = centers[:, 1],
            c = 'r', marker = 'D')
#marker : 산점도 모양 Diamond

plt.show()
* k값이 4인 경우. k값을 조절하고 싶으면 KMeans model 단계에서 조절

Best Cluster 찾는 방법
from sklearn.cluster import KMeans #model
from sklearn.datasets import load_iris #dataset
import matplotlib.pyplot as plt #시각화
1. dataset load
X, y = load_iris(return_X_y=True)
print(X.shape) #(150, 4)
print(X)
2. kMeans model
obj = KMeans(n_clusters=3)
model = obj.fit(X)
model 예측치
pred = model.predict(X)
3. Best Cluster
size = range(1, 11) # k값 범위(1~10)
inertia = [] # 군집의 응집도
* inertia value
- 군집의 응집도를 나타내는 수치(수치가 작을 수록 응집도가 좋다.)
- 중심점(centroid)에서 군집(cluster)내 포인트간의 거리 제곱의 합
- center수가 작을 수록 값이 커진다.
for k in size :
    obj = KMeans(n_clusters = k) # 1 ~ 10
    model = obj.fit(X)
    inertia.append(model.inertia_)

print(inertia)

plt.plot(size, inertia, '-o')
plt.xticks(size)
plt.show()
[해석] 급격히 하강한 후 3-5 사이에서 변화의 폭이 완만하다.
3-5사이의 클러스터로 분류하는 것이 적절하다고 판단한다.
추천시스템 모형
추천 시스템?
정보 필터링 (IF) 기술의 일종으로, 특정 사용자가 관심을 가질만한 정보 (영화, 음악, 책, 뉴스, 이미지, 웹 페이지 등)를 추천하는 시스템
추천 알고리즘
1. 협업 필터링(Collaborative Filtering : CF)
구매/소비 패턴이 비슷한 사용자를 한 집단으로 보고 그 집단에 속한 소비자들의 취향을 추천하는 방식
- UBCF(User Based CF) : 패턴이 비슷한 사용자를 기반으로 상품(Item) 추천 방식

추천 대상자(Active User)와의 유사도(Correlation Match)를 측정해서 가장 유사한 사람들의 평균값으로 추천상품을 도출
* 결측치가 많으면 신뢰성이 낮아질 수 있다는 단점이 있다.
- IBCF(Item Based CF) : 상품(Item)을 기반으로 연관성이 있는 상품(Item) 추천 방식

커피, 카페라테는 가장 비슷한 벡터 구조를 갖는다. 그러므로 커피를 샀을 때, 카페라테를 사라고 추천할 수 있다.
녹차는 커피와 카페라테와 다르므로 유사도가 낮아 추천해주지 않는다.
2. 내용기반 필터링(Content-Based Filtering : CB)
소비자가 소비하는 제품 중 텍스트 정보가 많은 제품 대상
뉴스, 책 등 텍스트의 내용을 분석해서 추천하는 방법
텍스트 중에서 형태소(명사, 동사 등)를 분석하여 핵심 키워드를 분석하는 기술이 핵심
3. 지식기반 필터링(Knowledge-Based Filtering : KB)
특정 분야에 대한 전문가의 도움을 받아서 그 분야에 대한 전체적 인 지식구조를 만들고 이를 활용하는 방법
추천 시스템 사례
넷플릭스 : 고객의 영화 평가를 바탕으로 특정 고객에게 영화 추천
아마존 : 제품 웹 페이지 방문 기록, 쇼핑장바구니 기능, 구매 상품 선호 등 다양한 정보를 토대로 추천 시스템 구현
협업 필터링의 유사도(Similarity) 계산 방법
상관계수(Correlation coefficient) 유사도 : Pearson 상관계수 이용
코사인(Cosine) 유사도 : 두 벡터 사이의 각도
유클리드안(Euclidean) : 거리 기반 유사도 계
Jaccard 유사도 : 이진화 자료(binary data) 대상 유사도 계산
특이값 분해 (SVD)
특이값 행렬 분해(Singular Value Decomposition)
차원축소(dimension reduction) 기법 : 특이값 생성
ex. 행렬 A(m x n) 분해
A(m사용자 X n아이템)의 NULL값 예측하는 과정이 특이값 분해.
P(M사용자 x k특이값) * Q.T(k특이값 x N아이템)
* 특이값 : 행렬의 특징을 나타내는 값. 알고리즘 이용 (차원축소에서 사용됨 ex. 5개 차원 -> 2개 차원 축소)
[실습] 영화 추천 시스템 알고리즘
추천 대상자 : Toby
유사도 평점 = 미관람 영화평점 * Toby와의 유사도
추천 영화 예측 = 유사도 평점 / Toby와의 유사도
import pandas as pd
1. 데이터 가져오기
ratings = pd.read_csv('D:/ITWILL/4_Python-2/data/movie_rating.csv')
print(ratings) #평가자[critic]   영화[title]  평점[rating]
2. pivot table 작성 : row(영화제목), column(평가자), cell(평점)
print('movie_ratings')
movie_ratings = pd.pivot_table(ratings,
               index = 'title',
               columns = 'critic',
               values = 'rating').reset_index()

print(movie_ratings) #default index 추가
3. 사용자 유사도 계산(상관계수 R) : 번호 행 추가 효과
sim_users = movie_ratings.corr().reset_index() #corr(method='pearson')
print(sim_users) #default index 추가
critic critic Claudia Gene Jack Lisa Mick Toby
0 Claudia 1.000000 0.314970 0.028571 0.566947 0.566947 0.893405
1 Gene 0.314970 1.000000 0.963796 0.396059 0.411765 0.381246
2 Jack 0.028571 0.963796 1.000000 0.747018 0.211289 0.662849
3 Lisa 0.566947 0.396059 0.747018 1.000000 0.594089 0.991241
4 Mick 0.566947 0.411765 0.211289 0.594089 1.000000 0.924473
5 Toby 0.893405 0.381246 0.662849 0.991241 0.924473 1.000000
4. Toby 미관람 영화 추출
1) movie_ratings table에서 title, Toby 칼럼으로 subset 작성
toby_rating = movie_ratings[['title', 'Toby']] #index 칼럼 추가
print(toby_rating)
칼럼명 교체
toby_rating.columns=['title', 'rating']
print(toby_rating)
critic title rating
0 Just My NaN
1 Lady NaN
2 Snakes 4.5
3 Superman 4.0
4 The Night NaN
5 You Me 1.0
2) Toby 미관람 영화제목 추출 : rating null 조건으로 title 추출
toby_not_see = toby_rating.title[toby_rating.rating.isnull()]
print(toby_not_see)
0 Just My
1 Lady
4 The Night
Series -> list
toby_not_see = list(toby_not_see)
3) raw data에서 Toby 미관람 영화 subset 생성
rating_t = ratings[ratings.title.isin(toby_not_see)]
print(rating_t)
critic title rating
0 Jack Lady 3.0
4 Jack The Night 3.0
5 Mick Lady 3.0
:
30 Gene The Night 3.0
5. Toby 미관람 영화 + Toby 유사도 join
1) Toby 유사도 추출
toby_sim = sim_users[['critic','Toby']] #critic vs Toby 유사도
2) 평가자 기준 병합
rating_t = pd.merge(rating_t, toby_sim, on='critic')
print(rating_t)
critic title rating Toby
0 Jack Lady 3.0 0.662849
1 Jack The Night 3.0 0.662849
2 Mick Lady 3.0 0.924473
6. 영화 추천 예측
1) 유사도 평점 계산 = Toby미관람 영화 평점 * Tody 유사도
rating_t['sim_rating'] = rating_t.rating * rating_t.Toby
print(rating_t)
critic title rating Toby sim_rating
0 Jack Lady 3.0 0.662849 1.988547
1 Jack The Night 3.0 0.662849 1.988547
2 Mick Lady 3.0 0.924473 2.773420
2) 영화제목별 합계
gsum = rating_t.groupby(['title']).sum() #영화 제목별 합계
3) 영화제목별 합계 Toby 영화추천 예측 = 유사도 평점 / Tody 유사도
print('\n*** 영화 추천 결과 ***')
gsum['predict'] = gsum.sim_rating / gsum.Toby
print(gsum)
rating similarity sim_rating predict
title
Just My 9.5 3.190366 8.074754 2.530981
Lady 11.5 2.959810 8.383808 2.832550
The Night 16.5 3.853215 12.899752 3.347790