DAY53. Python TreeModel (1)DicisionTree
decisionTree 의사결정트리
모델의 시각화가 쉽고, 가독성 높음(해석 쉬움)
특징(변수)의 스케일(정규화나 표준화)조정이 필요 없음
독립변수에 이진과 연속 변수가 혼합되어 있어도 잘 동작
많은 특징(입력변수)을 갖는 데이터 셋은 부적합
단일결정 Tree 학습으로 과적합 발생 우려 (일반화 성능 저하)
과적합 해결방안 : 가지치기 (CP : Cut Prune)
* 깊은 트리(복잡한 모델) : 과적합(↑), 오분류(↓)
의사결정나무(Decision Tree) 알고리즘
| 알고리즘 | 중요변수 평가지수 | 비고 |
| CART(Classification And Regression Trees) | GINI Index | 범주형과 숫자형 종속변수 패키지 : rpart |
| C5.0(C4.5) | Information Gain | 범주형과 숫자형 종속변수 패키지 : C50 |
Entropy & GINI
확률 변수 간의 불확실성을 나타내는 수치
Tree model에서 중요 변수(x) 선정 시 사용
1. C5.0(C4.5)에서는 정보이득 이용 : 정보이득이 클 수록 중요변수
2. CART에서는 GINI index 이용 : 지니 계수가 클 수록 중요변수
실습
import pandas as pd #csv file read
from sklearn.tree import DecisionTreeClassifier #Tree model
from sklearn.model_selection import train_test_split
from sklearn.metrics import accuracy_score
Tree 시각화
from sklearn.tree import export_graphviz #dot file 내보내기
from graphviz import Source #dot file 시각화 (pip install graphviz)
1. dataset load
dataset = pd.read_csv(r'C:\ITWILL\4_Python-2\data\tree_data.csv')
dataset.info()
# Column Non-Null Count Dtype
--- ------ -------------- -----
0 iq 6 non-null int64
1 age 6 non-null int64
2 income 6 non-null int64
3 owner 6 non-null int64
4 unidegree 6 non-null int64
5 smoking 6 non-null int64 -> y변수
dataset iq age income owner unidegree smoking
0 90 42 40 0 0 1
1 110 20 20 1 1 0
2 100 50 46 0 0 0
3 140 40 28 1 1 1
4 110 70 100 0 0 1
5 100 50 20 0 0 0
* decision tree의 장점 : x가 2진수여도 y의 분류모델을 만들 수 있음
cols = list(dataset.columns)
cols #[iq  age  income  owner  unidegree  smoking(y변수)]

X = dataset[cols[:-1]] #변수 5개 : iq, age, income, owner, unidegree
y = dataset[cols[-1]]
X.shape #(6, 5)
y.shape #(6, )
2. tree model 생성
model = DecisionTreeClassifier(random_state=123).fit(X, y)
dir(model)
tree의 깊이
model.get_depth() #3 -> 최상단 X제외하고 가지가 3개
model 예측치
y_pred = model.predict(X=X)
print(y_pred) #[1 0 0 1 1 0]
print(y)

acc = accuracy_score(y, y_pred)
print('accuracy =', acc) #accuracy = 1.0
3. tree model 시각화
feature_names = cols[:-1] #['iq', 'age', 'income', 'owner', 'unidegree']
class_names = ['No', 'Yes'] #y변수의 class명

export_graphviz
function sklearn.tree._export.export_graphviz
(decision_tree, out_file=None, *, max_depth=None, feature_names=None,
class_names=None, label='all', filled=False, leaves_parallel=False,
impurity=True, node_ids=False, proportion=False, rotate=False,
rounded=False, special_characters=False, precision=3)
graph = export_graphviz(model, out_file = "tree_graph.dot", #경로 설정 안 하면 기본 경로에 파일 저장
                feature_names = feature_names,
                class_names = class_names,
                filled = False,
                impurity = True,
                rounded = False)
filled = False : 색상 안 채우겠다
impurity = True : GINI 계수
rounded = False : 모서라 라운딩 안 하겠다
dot file read
file = open("tree_graph.dot")
dot_graph = file.read()
dot file 시각화
Source(dot_graph)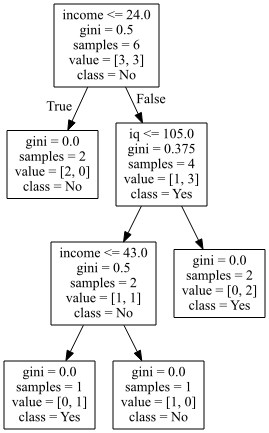
decisionTree_parameter
Dicision Tree Hyper parameter
과적합 관련 parameter
중요변수 선정 관련 parameter
from sklearn.datasets import load_iris #dataset
from sklearn.tree import DecisionTreeClassifier #Tree model
from sklearn.model_selection import train_test_split #훈련/검정셋
from sklearn.metrics import accuracy_score #tree model 시각화
from sklearn.tree import export_graphviz #dot file 내보내기
from graphviz import Source #dot file 시각화(pip install graphviz)
1.dataset load
iris = load_iris()
feature_names = iris.feature_names #list형식으로 x변수명 추출
#['sepal length (cm)', 'sepal width (cm)', 'petal length (cm)', 'petal width (cm)']
class_names = iris.target_names

X = iris.data
y = iris.target
2. train_test_split
X_train, X_test, y_train, y_test = train_test_split(
    X, y, test_size = 0.3, random_state = 123)
3. tree model 생성
criterion : defalut = "gini" 중요변수 선정 기준
splitter : defalut = "best" 각 노드의 분할 방법
max_depth : 최대 tree깊이(max_depth = 3) -> 과적합 제어 역할
min_sample_split : defalut = 2 내부노드 분할에 필요한 최소 샘플수
min_samples_leaf : defalut = 1 종단노드 분할에 필요한 최소 샘플수
tree = DecisionTreeClassifier (criterion = 'gini',
                       splitter = 'best',
                       max_depth = None,
                       min_samples_split = 2,
                       random_state = 123)

model = tree.fit(X = X_train, y = y_train)
중요 변수 느낌
model.feature_importances_ #array([0.01364196, 0.01435996, 0.5461181 , 0.42587999])
tree 깊이
model.get_depth() #5
4. model 평가
train_score = model.score(X = X_train, y = y_train)
test_score = model.score(X = X_test, y = y_test)

print('train score :', train_score) #train score : 1.0
print('test_socre :', test_score) #test_socre : 0.9555555555555556
5. tree model 시각화
graph = export_graphviz(model, out_file = "tree_graph.dot", #경로 설정 안 하면 기본 경로에 파일 저장
                feature_names = feature_names,
                class_names = class_names,
                filled = True,
                impurity = True,
                rounded = True)
dot file read
file = open("tree_graph.dot")
dot_graph = file.read()
dot file 시각화
Source(dot_graph)
새로운 모델 만들어보기
조건 : criterion = 'entropy', max_depth = 3
중요변수 선정 기준 지니계수 -> 엔트로피
과적합 발생을 가정하고, 두 개 가지치기
1. new model
tree2 = DecisionTreeClassifier (criterion = 'entropy',
                       splitter = 'best',
                       max_depth = 3,
                       min_samples_split = 2,
                       random_state = 123)

model2 = tree2.fit(X = X_train, y = y_train)
2. new model 평가
train_score = model2.score(X = X_train, y = y_train)
test_score = model2.score(X = X_test, y = y_test)

print('train score :', train_score) #train score : 0.9809523809523809
print('test_socre :', test_score) #test_socre : 0.9333333333333333
* 두 점수의 차가 작아지면 과적합이 해소되었다고 봄 -> 오분류가 적어졌고, 정확도가 낮아진다
3. new tree model 시각화
graph = export_graphviz(model, out_file = "tree_graph.dot", #경로 설정 안 하면 기본 경로에 파일 저장
                feature_names = feature_names,
                class_names = class_names,
                filled = True,
                impurity = True,
                rounded = True)
dot file read
file = open("tree_graph.dot")
dot_graph = file.read()
dot file 시각화
Source(dot_graph)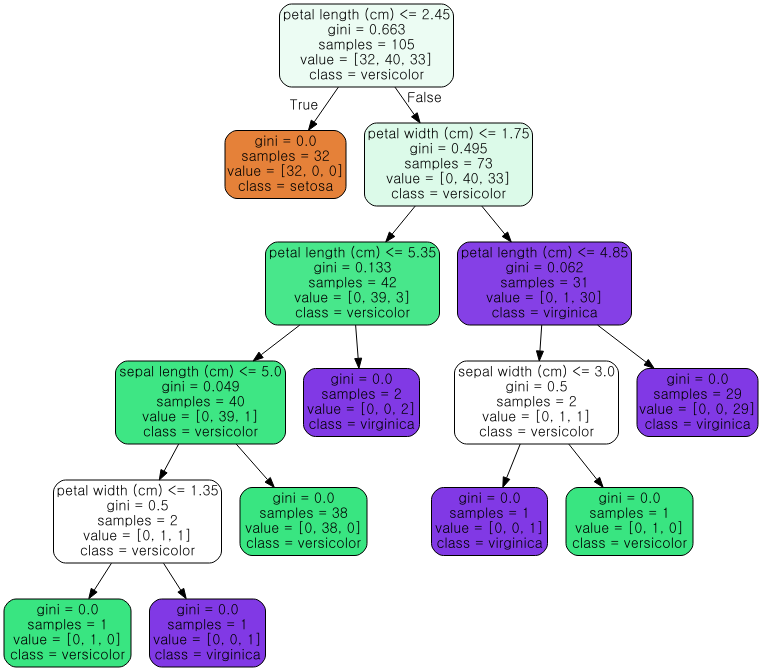
[해석] model튜닝 : 정확도는 떨어졌으나, 과적합을 해결
중요변수 선정기준 : 가장 중요한 변수는 petal length. 지니계수와 엔트로피가 유사함.